Monday, 23 April 2018

Hi Guys

Its been almost 6 years that I haven't posted anything.
The reason is, I had some huge loss back in 2013 or end of 2012.
Not because of trading but because of money transfer service.
I had bad luck to trust Liberty Reserve for once with huge amount.
It was my fault as I never was convinced by Liberty reserve services but
still wanted quickly sell a huge part of my investment and the next morning I heard US Govt already had shut down that company.
Then there was some family emergency and I entrusted one of my friends to trade for me as I had to recover my loss but that Friend didn't follow my strategy and he lost all of my investment with his
stupid auto trading. Since then I disappeared for a long time and was very upset.
Still struggling and have desire to trade but have no investment. I'm working now for a multinational
research based consulting firm as an account and BD manager.
I had managed to grow from 5k to 40+k within short period of time and was doing very well.
I have disappointed my FB friends by not letting them know the actual reason of my disappearance.
My deep apologies for the disappointment.
I still can be contacted but for security and privacy reason I won't be able to share my Mobile number here. Anyone who is interested to invest a big amount of 10k and above can email me at i.khan12481@gmail.com. My plan is to get investor and then become a full time trader again.
I'll share my all contacts once we connect.

Thank you,
Khan

Friday, 9 November 2012

WHERE TO BUY OR SELL AND WHERE TO PUT STOP LOSS?

Every trader has his/her own way of trading so I have my own way of trading. In my Facebook Group https://www.facebook.com/groups/KhanFX/  I normally post signals everyday. In that, I suggest BUY LEVEL and SELL LEVEL  and  target as well.
Remember one thing that for every breakout there is confirmation, without confirmation trading is risky. Just keep in your mind that its better to win few pips rather than losing many pips. So always wait for proper breakout of any level which is important.
I suggest U draw horizontal lines at each round figure like 1.20000, 1.20250, 1.20500, 1.20750 and 1.21000... So try to divide 100 pips into 4 equal parts. or use any indicator as now a days Indicators can be found which draw horizontal lines for you and you may setup levels like round figures like 100 pips or 250 pips distance between 2 lines. Breakout of one level will take U to another.
Other than that focus on those levels which are being tested few times. Draw horizontal lines on both levels, calculate the distance between those 2 levels in pips and wait for its breakout.Breakout of any level will give U the same pips as the distance between 2 levels. I have been tested this method many times and it worked very well. For STOP LOSS, ENTRY POINT , CONFIRMATION OF BREAKOUT and FAKE BREAKOUT  check out the image below:

Tuesday, 23 October 2012

KFX Simple Template for beginners


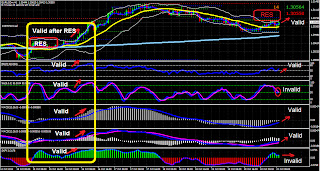
My this new strategy for beginners is very helpful. I explained all the indicators used in this strategy. Look at the chart below and then read all below that chart:


INDICATORS USED IN THIS STRATEGY
ASK+BID+SPREAD-INDI :-  
This Indicator shows Ask, Bid and spread on the upper right corner. So easy to know the difference between Buy and Sell price. So before entry check out spread as well and try to choose low spread.
Bands:-   
Bands  are well known, It has 3 lines and price moves within that 3 lines. When these 3 lines expand that shows market is fast. So before you enter check out the lines and also the middle line plays an important role. In my strategy I coloured the middle line as Yellow. Avoid entry when 3 lines are close.
Support & Resistance Indicator:-
This is a very important indicator which U can use for breakouts. This indicator draws support/resistance on chart and we should know the value of support/resistance. So before you enter check out resistance/support as well whether the price is trying to break or going to rebound from that S/R.
EMA 3 (EXPONENTIAL MOVING AVERAGE ):-
This EMA plays an important role and U should focus on it to catch the signal. In my strategy I coloured this EMA  as blue. This will indicate you to the right direction where the price goes. So before you enter check out the direction of this EMA. 
MA 200 (SIMPLE MOVING AVERAGE ):-
This SMA is my favourite as it plays a very important role. I use this sometimes for Long term trade. So when U see Price crosses this SMA, just wait for the confirmation and then enter for long term. 
RSI:-
RSI is a well known Indicator which directs U to the right direction where price goes. So before you enter check out the direction of RSI as well. In my strategy I put levels in this Indicator that are 20, 50 and 80. Above 50 is buy zone and below 50 is Sell zone. Above 80 indicates overbought condition and below 20 indicates oversold condition.
STOCHASTIC:-
This is almost similar to RSI but they are not same just the difination is almost same. U have to check out its direction as well before U enter. It has 2 lines one Pink and one Blue, so when Blue line crosses pink upward the pink line's direction will also be upward which means price goes up while downward direction of both lines means price is going down. In my strategy I put levels in this Indicator that are 20, 50 and 80. Above 50 is buy zone and below 50 is Sell zone. Above 80 indicates overbought condition and below 20 indicates oversold condition.
MACD:-
MACD is used to spot changes in the strength, direction, momentum, and duration of a trend in a stock's price. When U see zero level is crossed , there you have to focus. In this oscillator or indicator the blue line will also guide you to the right direction. Above/Below zero level if volumes are getting reduced that also tells you the direction towards zero level. 
MACD Modified:-
This is also MACD and works similar as MACD but this Indicator has 2 lines one Pink and one Blue, so when Blue line crosses pink upward the pink line's direction will also be upward which means price goes up while downward direction of both lines means price is going down. U have to look at these lines and volumes as well.
SKFX:-
This is also almost similar to MACD and works almost similar as MACD . Green volumes above zero level indicate buy zone and Red volumes below zero level indicate Sell zone.This Indicator has 1 Blue line also, which indicates the direction of price where it goes. U have to look at this line and volumes as well.
=============================================================================
WHERE TO ENTER, HOW TO FIND SIGNAL?
As U read about indicators used in this strategy, so it will be easy for U to undersatnd now. 
In this strategy I coloured all the important lines as Blue, so in simple words when U see all blue lines facing upward then U should know its Buy signal BUT to find strong signal U must wait for the cross between Middle line (Yellow one) of Bollinger Bands and 3 EMA (Blue one). If 3 EMA is crossing Middle line of Bollinger Bands Upward and the cross is valid then all blue lines will follow the direction of 3 EMA. If U find all lines in similar direction then only enter. 
HOW TO AVOID POTENTIAL PROBLEMS?
When U find all lines in similar direction after a valid cross then U look at Support/Resistance near by if that is too close then wait for its breakout. ALSO avoid entry when 3 Lines of Bollinger Bands are too close which means market is slow.  
WHAT TO DO WITH MOVING AVERAGE 200?
As I said in its description also that This SMA is my favourite as it plays a very important role. I use this sometimes for Long term trade. So when U see this SMA  valid breakout ( when price crosses this line) just wait for the confirmation and then enter for long term. 
CAN I ENTER WHEN I FIND ALL INDICATORS HAVE SIMILAR DIRECTIONS BUT JUST ONE HAS DIFFERENT DIRECTION?
My Answer is NO... I mean its not advisable..

HOW TO INSTALL THIS ALL?
Download Zip folder "KFX Simple Template for beginners"to your computer. Copy all of ex4 files means Indicators inside indicators folder which are 8 in numbers. Go to your Metatrader folder where it is installed. . Paste in expert/Indicators.
Now copy another tpl file ( KFX Simple Template for beginners), go to the same folder as U went before but this time U Paste in Templates not  in expert/Indicators or expert/templates.
HOW TO APPLY TO YOUR CHART?
Right click on your metatrader screen( on chart), list will appear. Go to templates just below periodicity, another list will appear. Select and click on "KFX Simple Template for beginners" . 

DOWNLOAD THE TEMPLATE AND WHOLE INDICATORS IN ONE ZIP FOLDER FROM HERE FOR FREE > http://www.4shared.com/zip/TPumxDcV/KFX_Simple_Template_for_beginn.html?


Friday, 3 August 2012

HOW TO TRADE WITHOUT USING INDICATOR (2)

This chart is about Yesterday Market ( EUR/USD 30 Min, 02-08-2012) ...
After reading all what I typed on this chart, you will have 2 questions:
1- How can I know this area is important?
2- How can I know this level can be a support or a resistance?
About 2nd question I already explained in my Blog but the first one is a million dollar question. About this I will explain in future. U just need to focus on resistance and Support levels only for now.

I always mention few things: Proper breakout, confirmation, TP and SL.
People will say that I always mention confirmation only or breakout only but believe I still earned +140 pips just in EUR/USD using my own strategy. I didn't break my rules. I was patient. Yes there is a super big candle. Some will think of it but I suggest, don't ever try to climb a running bus but wait for its stop and proper stop. This is my strategy , maybe some will make fun and consider it is a stupid idea but for me it works very well alhamdolillah.


Wednesday, 1 August 2012

HOW TO TRADE WITHOUT USING INDICATOR (1)

In the chart below EUR/USD shows its up move but we have to know where to enter. So lets discuss:
Comment please!
explained in comments below. 

Monday, 23 July 2012

3, 30 Simple MA Cross


This is a very profitable system.
SELL:- When U see a cross like Red Line is above Blue, just wait for next candle. If next candle is also      bearish then sell out.
BUY:-   When U see a cross like Blue is above Red Line, just wait for confirmation means for next candle. Do not rush and don't trade against the trend.
WHEN TO EXIT?
Exit when you see another cross against your trade but if you want , you can take small small profits also.
Do not exit just becoz you see lines come closer for a cross. U should know that there can be a fake cross also. Look at the chart below: 


HOW TO PUT THESE MOVING AVERAGES?
 Go to Insert > Indicators > Trend > Moving average, click . New window will appear as shown in the image below:

U will see period value 14. Change that to 30,  select any big size for line , so that it will look thick than another line. Click "ok".
Now for another Line, U go again to Insert > Indicators > Trend > Moving average, click . New window will appear again as shown in the image above. 
U will see this time period value 30 but U change it to 3, select Blue clour for it and any size so that it will look thin than another red line. Now click" ok".


Monday, 16 July 2012

Support & Resistance Indicator

This is very important Indicator which draws for you Support and Resistance levels. We must know that these Levels are very important. Price normally follow these levels. Look at the chart below:

Download this Indicator for free from here>  http://www.4shared.com/file/UFGtRzmd/Support__Resistance_Indicator.html?