This Blog is basically created for Forex Traders to share their ideas, to help others and to get help from others. About me:- I trade Forex without using Indicators following Price Action. I got the basic from my own wife, then studied some ebooks and sites and practiced few brokers.I will start teaching from 1st Of August 2012 Insha Allah for free.U can add me in FB also. My Facebook ID is KhanFX.My.اُردو یا پشتو کے لیے ایڈمِن سے رابطہ کریں فیس بُک کے ذریعے یا بلاگ میں کمِنٹ کے ذریعے۔
Saturday, 7 July 2012
Best Entry Signals Strategy
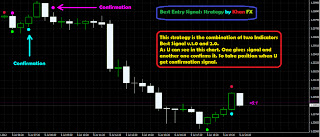
This strategy is the combination of two Indicators Best Signal v.1.0 and Best Signal v.2.0.
As U can see in this chart. One gives signal and another one confirms it. So take position when U get confirmation signal.
BUY:- When U get confirmation Signal that is Aqua colour dot.
SELL:- When U get confirmation Signal that is Magenta colour dot.
How to Install?
Download rar file Best Entry Signals Strategy to you computer. Copy both of ex4 files. Go to your Metatrader folder where it is installed. . Paste in expert/Indicators.
Now copy another tpl file ( Best Entry Signals Strategy), go to the same folder as U went before but this time U Paste in Templates not in expert/Indicators or expert/templates.
How to apply to your chart?
Right click on your metatrader screen( on chart), list will appear. Go to templates just below periodicity, another list will appear. Select and click on Best Entry Signals Strategy.
DOWNLOAD IT FROM HERE FOR FREE> http://www.4shared.com/rar/EIkXuL_9/Best_entry_signals_strategy.html
Best Entry Signal v.2.0
BUY:- when U see Aqua ( colour ) Signal
SELL:- when U see Magenta ( colour ) Signal
Try it on demo first..
DOWNLOAD IT FROM HERE FOR FREE> http://www.4shared.com/file/tYW8vMco/Best_Entry_Signal_v20.html
Friday, 6 July 2012
BMA-1 and BMA-2
BMA-1 and BMA-2 are basically moving avrages which will lead you to the right direction and you can know where the trend is going. The distance between two lines will also show you the power of trend after any cross.
BMA-1 and BMA-2 cross is important. try to follow the correct cross. If downtrend then the cross will be Red, if Uptrend then the cross will be Green.
Try to avoid fake cross unless it really shows a big move. But I suggest to avoid it first.
When a cross happens, wait for the confirmation. Otherwise, you can use these averages for direction to lead you. I think its better to have averages like this on your chart.
Download it from here fro free > http://www.4shared.com/rar/iF8RIerX/BMA-12.html
Wednesday, 4 July 2012
How to trade editing Fibonacci Levels?
In Fibonacci we follow trend's direction but here U have to do the opposite of that. Like I drew from up to low but the most recent small trend in 1 Hr chart. No U can see the Entry Level , TP1,TP2 and SL... Try it on Demo first then apply to your real.
For this U have to edit Fibo Levels. Go to properties of Fibo, click on Fibo Levels. Do not edit Level but Descriptions. Copy these values one by one and paste in the descriptions values as shown in the picture.
TP2 Level 0.0 - %$
TP1 Level 23.6 - %$
38.2 - %$
Entry Level 50.0 - %$
61.8 - %$
SL Level 100.0 - %$
Upto here only, the rest if u want to put , so its ok.
-------------------------------------------------------------------------
1.618 - %$
261.8 - %$
423.6 - %$
There is Indicator also for this. it will draw itself everything for U but that normally works on EUR/USD 1 Hr and 5 Minutes charts. Others are not advisable. If U want to try, then
Download it from here for free>http://www.4shared.com/file/gcuN1Ldg/Vec-Scalperz.html
Subscribe to:
Comments (Atom)


