Friday, 9 November 2012

WHERE TO BUY OR SELL AND WHERE TO PUT STOP LOSS?

Every trader has his/her own way of trading so I have my own way of trading. In my Facebook Group https://www.facebook.com/groups/KhanFX/  I normally post signals everyday. In that, I suggest BUY LEVEL and SELL LEVEL  and  target as well.
Remember one thing that for every breakout there is confirmation, without confirmation trading is risky. Just keep in your mind that its better to win few pips rather than losing many pips. So always wait for proper breakout of any level which is important.
I suggest U draw horizontal lines at each round figure like 1.20000, 1.20250, 1.20500, 1.20750 and 1.21000... So try to divide 100 pips into 4 equal parts. or use any indicator as now a days Indicators can be found which draw horizontal lines for you and you may setup levels like round figures like 100 pips or 250 pips distance between 2 lines. Breakout of one level will take U to another.
Other than that focus on those levels which are being tested few times. Draw horizontal lines on both levels, calculate the distance between those 2 levels in pips and wait for its breakout.Breakout of any level will give U the same pips as the distance between 2 levels. I have been tested this method many times and it worked very well. For STOP LOSS, ENTRY POINT , CONFIRMATION OF BREAKOUT and FAKE BREAKOUT  check out the image below:

Tuesday, 23 October 2012

KFX Simple Template for beginners


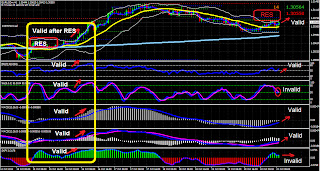
My this new strategy for beginners is very helpful. I explained all the indicators used in this strategy. Look at the chart below and then read all below that chart:


INDICATORS USED IN THIS STRATEGY
ASK+BID+SPREAD-INDI :-  
This Indicator shows Ask, Bid and spread on the upper right corner. So easy to know the difference between Buy and Sell price. So before entry check out spread as well and try to choose low spread.
Bands:-   
Bands  are well known, It has 3 lines and price moves within that 3 lines. When these 3 lines expand that shows market is fast. So before you enter check out the lines and also the middle line plays an important role. In my strategy I coloured the middle line as Yellow. Avoid entry when 3 lines are close.
Support & Resistance Indicator:-
This is a very important indicator which U can use for breakouts. This indicator draws support/resistance on chart and we should know the value of support/resistance. So before you enter check out resistance/support as well whether the price is trying to break or going to rebound from that S/R.
EMA 3 (EXPONENTIAL MOVING AVERAGE ):-
This EMA plays an important role and U should focus on it to catch the signal. In my strategy I coloured this EMA  as blue. This will indicate you to the right direction where the price goes. So before you enter check out the direction of this EMA. 
MA 200 (SIMPLE MOVING AVERAGE ):-
This SMA is my favourite as it plays a very important role. I use this sometimes for Long term trade. So when U see Price crosses this SMA, just wait for the confirmation and then enter for long term. 
RSI:-
RSI is a well known Indicator which directs U to the right direction where price goes. So before you enter check out the direction of RSI as well. In my strategy I put levels in this Indicator that are 20, 50 and 80. Above 50 is buy zone and below 50 is Sell zone. Above 80 indicates overbought condition and below 20 indicates oversold condition.
STOCHASTIC:-
This is almost similar to RSI but they are not same just the difination is almost same. U have to check out its direction as well before U enter. It has 2 lines one Pink and one Blue, so when Blue line crosses pink upward the pink line's direction will also be upward which means price goes up while downward direction of both lines means price is going down. In my strategy I put levels in this Indicator that are 20, 50 and 80. Above 50 is buy zone and below 50 is Sell zone. Above 80 indicates overbought condition and below 20 indicates oversold condition.
MACD:-
MACD is used to spot changes in the strength, direction, momentum, and duration of a trend in a stock's price. When U see zero level is crossed , there you have to focus. In this oscillator or indicator the blue line will also guide you to the right direction. Above/Below zero level if volumes are getting reduced that also tells you the direction towards zero level. 
MACD Modified:-
This is also MACD and works similar as MACD but this Indicator has 2 lines one Pink and one Blue, so when Blue line crosses pink upward the pink line's direction will also be upward which means price goes up while downward direction of both lines means price is going down. U have to look at these lines and volumes as well.
SKFX:-
This is also almost similar to MACD and works almost similar as MACD . Green volumes above zero level indicate buy zone and Red volumes below zero level indicate Sell zone.This Indicator has 1 Blue line also, which indicates the direction of price where it goes. U have to look at this line and volumes as well.
=============================================================================
WHERE TO ENTER, HOW TO FIND SIGNAL?
As U read about indicators used in this strategy, so it will be easy for U to undersatnd now. 
In this strategy I coloured all the important lines as Blue, so in simple words when U see all blue lines facing upward then U should know its Buy signal BUT to find strong signal U must wait for the cross between Middle line (Yellow one) of Bollinger Bands and 3 EMA (Blue one). If 3 EMA is crossing Middle line of Bollinger Bands Upward and the cross is valid then all blue lines will follow the direction of 3 EMA. If U find all lines in similar direction then only enter. 
HOW TO AVOID POTENTIAL PROBLEMS?
When U find all lines in similar direction after a valid cross then U look at Support/Resistance near by if that is too close then wait for its breakout. ALSO avoid entry when 3 Lines of Bollinger Bands are too close which means market is slow.  
WHAT TO DO WITH MOVING AVERAGE 200?
As I said in its description also that This SMA is my favourite as it plays a very important role. I use this sometimes for Long term trade. So when U see this SMA  valid breakout ( when price crosses this line) just wait for the confirmation and then enter for long term. 
CAN I ENTER WHEN I FIND ALL INDICATORS HAVE SIMILAR DIRECTIONS BUT JUST ONE HAS DIFFERENT DIRECTION?
My Answer is NO... I mean its not advisable..

HOW TO INSTALL THIS ALL?
Download Zip folder "KFX Simple Template for beginners"to your computer. Copy all of ex4 files means Indicators inside indicators folder which are 8 in numbers. Go to your Metatrader folder where it is installed. . Paste in expert/Indicators.
Now copy another tpl file ( KFX Simple Template for beginners), go to the same folder as U went before but this time U Paste in Templates not  in expert/Indicators or expert/templates.
HOW TO APPLY TO YOUR CHART?
Right click on your metatrader screen( on chart), list will appear. Go to templates just below periodicity, another list will appear. Select and click on "KFX Simple Template for beginners" . 

DOWNLOAD THE TEMPLATE AND WHOLE INDICATORS IN ONE ZIP FOLDER FROM HERE FOR FREE > http://www.4shared.com/zip/TPumxDcV/KFX_Simple_Template_for_beginn.html?


Friday, 3 August 2012

HOW TO TRADE WITHOUT USING INDICATOR (2)

This chart is about Yesterday Market ( EUR/USD 30 Min, 02-08-2012) ...
After reading all what I typed on this chart, you will have 2 questions:
1- How can I know this area is important?
2- How can I know this level can be a support or a resistance?
About 2nd question I already explained in my Blog but the first one is a million dollar question. About this I will explain in future. U just need to focus on resistance and Support levels only for now.

I always mention few things: Proper breakout, confirmation, TP and SL.
People will say that I always mention confirmation only or breakout only but believe I still earned +140 pips just in EUR/USD using my own strategy. I didn't break my rules. I was patient. Yes there is a super big candle. Some will think of it but I suggest, don't ever try to climb a running bus but wait for its stop and proper stop. This is my strategy , maybe some will make fun and consider it is a stupid idea but for me it works very well alhamdolillah.


Wednesday, 1 August 2012

HOW TO TRADE WITHOUT USING INDICATOR (1)

In the chart below EUR/USD shows its up move but we have to know where to enter. So lets discuss:
Comment please!
explained in comments below. 

Monday, 23 July 2012

3, 30 Simple MA Cross


This is a very profitable system.
SELL:- When U see a cross like Red Line is above Blue, just wait for next candle. If next candle is also      bearish then sell out.
BUY:-   When U see a cross like Blue is above Red Line, just wait for confirmation means for next candle. Do not rush and don't trade against the trend.
WHEN TO EXIT?
Exit when you see another cross against your trade but if you want , you can take small small profits also.
Do not exit just becoz you see lines come closer for a cross. U should know that there can be a fake cross also. Look at the chart below: 


HOW TO PUT THESE MOVING AVERAGES?
 Go to Insert > Indicators > Trend > Moving average, click . New window will appear as shown in the image below:

U will see period value 14. Change that to 30,  select any big size for line , so that it will look thick than another line. Click "ok".
Now for another Line, U go again to Insert > Indicators > Trend > Moving average, click . New window will appear again as shown in the image above. 
U will see this time period value 30 but U change it to 3, select Blue clour for it and any size so that it will look thin than another red line. Now click" ok".


Monday, 16 July 2012

Support & Resistance Indicator

This is very important Indicator which draws for you Support and Resistance levels. We must know that these Levels are very important. Price normally follow these levels. Look at the chart below:

Download this Indicator for free from here>  http://www.4shared.com/file/UFGtRzmd/Support__Resistance_Indicator.html?

Tuesday, 10 July 2012

BMA-400 Breakout Strategy


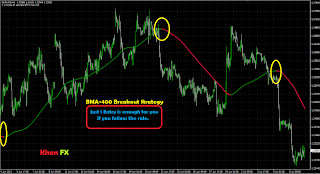
This is an amazing strategy. You can earn 100 to 200 pips in one deal if you follow the rule.
Look at the chart below:

In the chart above you can see a line and breakout. These are moving averages which will tell you the direction of trend also but here we have to do one thing that when you see breakout downward , Do not enter because the line will still be Green. Enter when Line is getting Red. Uptrend breakout is the opposite of downtrend breakout. When you see uptrend breakout, Do not enter until the Line is Green.
Follow the rule and enjoy...
For this you just have to download BMA-400 Breakout , which is not exactly indicator but moving averages.

DOWNLOAD IT FROM HERE FOR FREE> http://www.4shared.com/file/eM6_Dk9p/BMA-400_Breakout.html

Saturday, 7 July 2012

Best Entry Signals Strategy


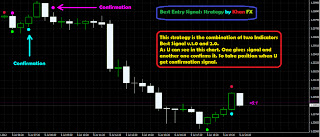
This strategy is the combination of two Indicators Best Signal v.1.0 and Best Signal v.2.0.
As U can see in this chart. One gives signal and another one confirms it. So take position when U get confirmation signal.

BUY:- When U get confirmation Signal that is Aqua colour dot.
SELL:- When U get confirmation Signal that is Magenta colour dot.

How to Install?
Download rar file Best Entry Signals Strategy to you computer. Copy both of ex4 files. Go to your Metatrader folder where it is installed. . Paste in expert/Indicators.
Now copy another tpl file ( Best Entry Signals Strategy), go to the same folder as U went before but this time U Paste in Templates not  in expert/Indicators or expert/templates.
How to apply to your chart?
Right click on your metatrader screen( on chart), list will appear. Go to templates just below periodicity, another list will appear. Select and click on Best Entry Signals Strategy.

DOWNLOAD IT FROM HERE FOR FREE> http://www.4shared.com/rar/EIkXuL_9/Best_entry_signals_strategy.html

Best Entry Signal v.2.0


BUY:-  when U see Aqua ( colour ) Signal

SELL:- when U see Magenta ( colour ) Signal

Try it on demo first..

DOWNLOAD IT FROM HERE FOR FREE> http://www.4shared.com/file/tYW8vMco/Best_Entry_Signal_v20.html

Friday, 6 July 2012

BMA-1 and BMA-2


BMA-1 and BMA-2 are basically moving avrages which will lead you to the right direction and you can know where the trend is going. The distance between two lines will also show you the power of trend after any cross.
BMA-1 and BMA-2 cross is important. try to follow the correct cross. If downtrend then the cross will be Red, if Uptrend then the cross will be Green.
Try to avoid fake cross unless it really shows a big move. But I suggest to avoid it first.
 When a cross happens, wait for the confirmation. Otherwise, you can use these averages for direction to lead you. I think its better to have averages like this on your chart.

Download it from here fro free > http://www.4shared.com/rar/iF8RIerX/BMA-12.html

Wednesday, 4 July 2012

How to trade editing Fibonacci Levels?


In Fibonacci we follow  trend's direction but here U have to do the opposite of that. Like I drew from up to low but the most recent small trend in 1 Hr chart. No U can see the Entry Level , TP1,TP2  and SL... Try it on Demo first then apply to your real.
For this U have to edit Fibo Levels. Go to properties of Fibo, click on Fibo Levels. Do not edit Level but Descriptions. Copy these values one by one and paste in the descriptions values as shown in the picture.
TP2 Level 0.0 - %$
TP1 Level 23.6 - %$
38.2 - %$
Entry Level 50.0 - %$
61.8 - %$
SL Level 100.0 - %$
Upto here only, the rest if u want to put , so its ok.
-------------------------------------------------------------------------
1.618 - %$
261.8 - %$
423.6 - %$

There is Indicator also for this. it will draw itself everything for U but that normally works on EUR/USD 1 Hr and 5 Minutes charts. Others are not advisable. If U want to try, then
Download it from here for free>http://www.4shared.com/file/gcuN1Ldg/Vec-Scalperz.html

Wednesday, 27 June 2012

HULL MOVING AVERAGES

HULL MOVING AVERAGES
Lead you to the right direction. Like this you can avoid wrong entries and signals.
If it shows downtrend , do not Buy and if it shows uptrend, do not Sell. As sometimes we can take position for short term and can earn also but not always. So be careful with wrong signals.
In below image crimson and green colour line is Hull Moving average , while crimson and Lime dots are not included in this indicator. That is different indicator , " Best Entry Signal v.1.0". You can download that too for free.


DOWNLOAD FOR FREE > http://www.4shared.com/file/kSNpCrva/Hull_moving_averages_HMA.html

Saturday, 23 June 2012

Best Entry Signal v.1.0


Best Entry Signal Indicator is really best. It can provide you a couple of true entry signals.
CURRENCY PAIR:- Almost all currency pairs.
TIME FRAME:- It works in any time frame, recommended for 15, 30 and 60 Min Time frames.
HOW TO ENTER?
BUY SIGNAL:- When you get BUY Signal, wait for the candle to really start going up and then put Buy order. Do not trade against the trend.
SELL SIGNAL:-  Same as Buy.. When you get SELL Signal, wait for the candle to really start going Down and then put Sell order. Do not trade against the trend.


DOWNLOAD FROM HERE> http://www.4shared.com/file/psDgR_nK/Best_Entry_Signal_v10.html

Friday, 22 June 2012

Rubicon Indicators with sound Alert

Rubicon Indicator is based on price movement.It can be used on all time frames although it performs very well on 30 min charts.The indicator marks the trade entry as a green ( yellow in Modified ) line on the chart then prints stop loss and take profit on the chart. You can see in chart below:
Download from here >  http://www.4shared.com/rar/nHX0gebR/Rubicon_Indicator.html

Monday, 18 June 2012

1 Minute Scalping Strategy

-->
1 minute scalping strategy By Khan FX
This strategy is great!
Usually You can expect: +70% of profitable trades.
Pairs: GBP/JPY or USD/JPY or other JPY cross pairs (GBP/JPY mainly)
Charts: 1Min, 5Min
Indicators: bollinger bands – 3 sets
Deviation 2 (Red) – Period 50
Deviation 3 (Pink) – Period 50
Deviation 4 (yellow) – Period 50
Target: 5-10 pips
How to Install?
Download Tpl file 1 minute scalping strategy to your computer. Copy that file. Go to your Metatrader folder where it is installed, Paste in Templates. Not in expert/templates.
How to apply to your 1 minute chart?
Right click on your metatrader screen( on chart), list will appear. Go to templates just below periodicity, another list will appear. Select and click on 1 minute scalping strategy.

Notice:- The 3 sets of bollinger bands on your chart will appear. The
price will always move between these lines – Red, Pink
and Yellow.
Where to Enter
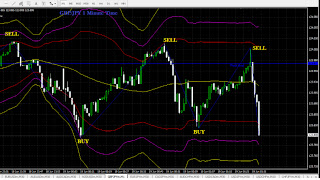
SELL: Watch when the price crosses the
upper red band , at least half way (or touch) to the pink band
(if it gets to the yellow band is much stronger signal..) Then
the price will tend to retrace towards the center of the
bollinger bands, you profit from this retracing.
BUY: It is the same as selling, the difference
is that we will wait for the price to range between the lower
red and yellow bands, and trade the retracing towards the
center.
Note for This system: Do not trade on ranging, do not trade on
the news releases.
Where to put Stop Loss?
since this strategy requires you to look at the
screen (remember this is the 1M time frame) I tend to have
two kinds of stops: time based and loss based.
Time based: Try and figure out how long will it take the
market to get in your expected direction, if the time that you
planned is already due, then close the order. No point on
waiting for a loss...
Stop Loss: Since you are trading a very tight time frame your
stops should also very very tight. Sometimes, you will profit
from a 3 minute trade and you wont be able to set a proper
S/L. So your stops will be given to you by your money
management system...
========================================

Some instructions about the recent changes in strategy.
========================================
I have added one more indicator which will alert U but U have to follow only when there is retracement from red or pink or yellow band not middle yellow band. If U see a retracement from these bands towards middle yellow band, just make entry even if U don't have any alert. Alert is just to inform U only. 
In previous strategy, sometimes we could have this confusion that the price already reached to red or pink or even yellow band but still there was no retracement. Anyways, for that we suppose not to trade in ranging market or news release etc but still we need to know whether there is retracement or not. So for that the indicator I added will alert U or if it doesn't alert U then it will atleast change its colour and show the direction. U can see in new image I added. Its very clear. Blue colour is for up move and red colour is for down move.

Hope U understand. In case of any confusion just leave a comment please. I will try to reply.
Regards

KhanFX
=========================================== 


DOWNLOAD this strategy from here for free:> 1 Minute scalping Strategy by Khan FX

Sunday, 17 June 2012

Best Broker ( Exness)


The best broker I ever used.. Exness..
Open account in Exness by clicking on the icon of Exness at right side or at the bottom of this blog.
 If any question you can ask. I used many brokers but I found this one the best. I am not simply saying to open account. If you don't believe, then just try demo first and try to differentiate the prices in this broker with others. If you have any problem, U can join me in my Group. http://www.facebook.com/groups/KhanFX/

EMA 5 10 34 Crossover

EMA 5 10 34 Crossover

Instructions are available on chart for this Indicator.